Getting Started
Gosling.js is a declarative grammar for interactive (epi)genomics visualization on the Web.
To get started with Gosling, we recommend going through the Create Single Track Visualization Tutorial. Then, you can explore examples in the online editor, go through the grammar guide, and start building your own Gosling visualizations using the the grammar reference and JavaScript API documentation.
Please see usage guide to learn about all the contexts in which Gosling can be used.
What is a grammar for data visualization?
Words are combined together into sentences based on their parts of speech and grammar rules. In a similar way, visual components (e.g., a coordinate axis, plot markers, and legends) have specific roles and are combined according to certain rules. You probably know these rules without realizing it! These roles and rules have been made explicit, such as in the Grammar of Graphics.
Similarly, genomic data visualizations can be understood as being made up of components which follow a set of rules. The Gosling grammar formalizes these rules for genomic data visualizations.
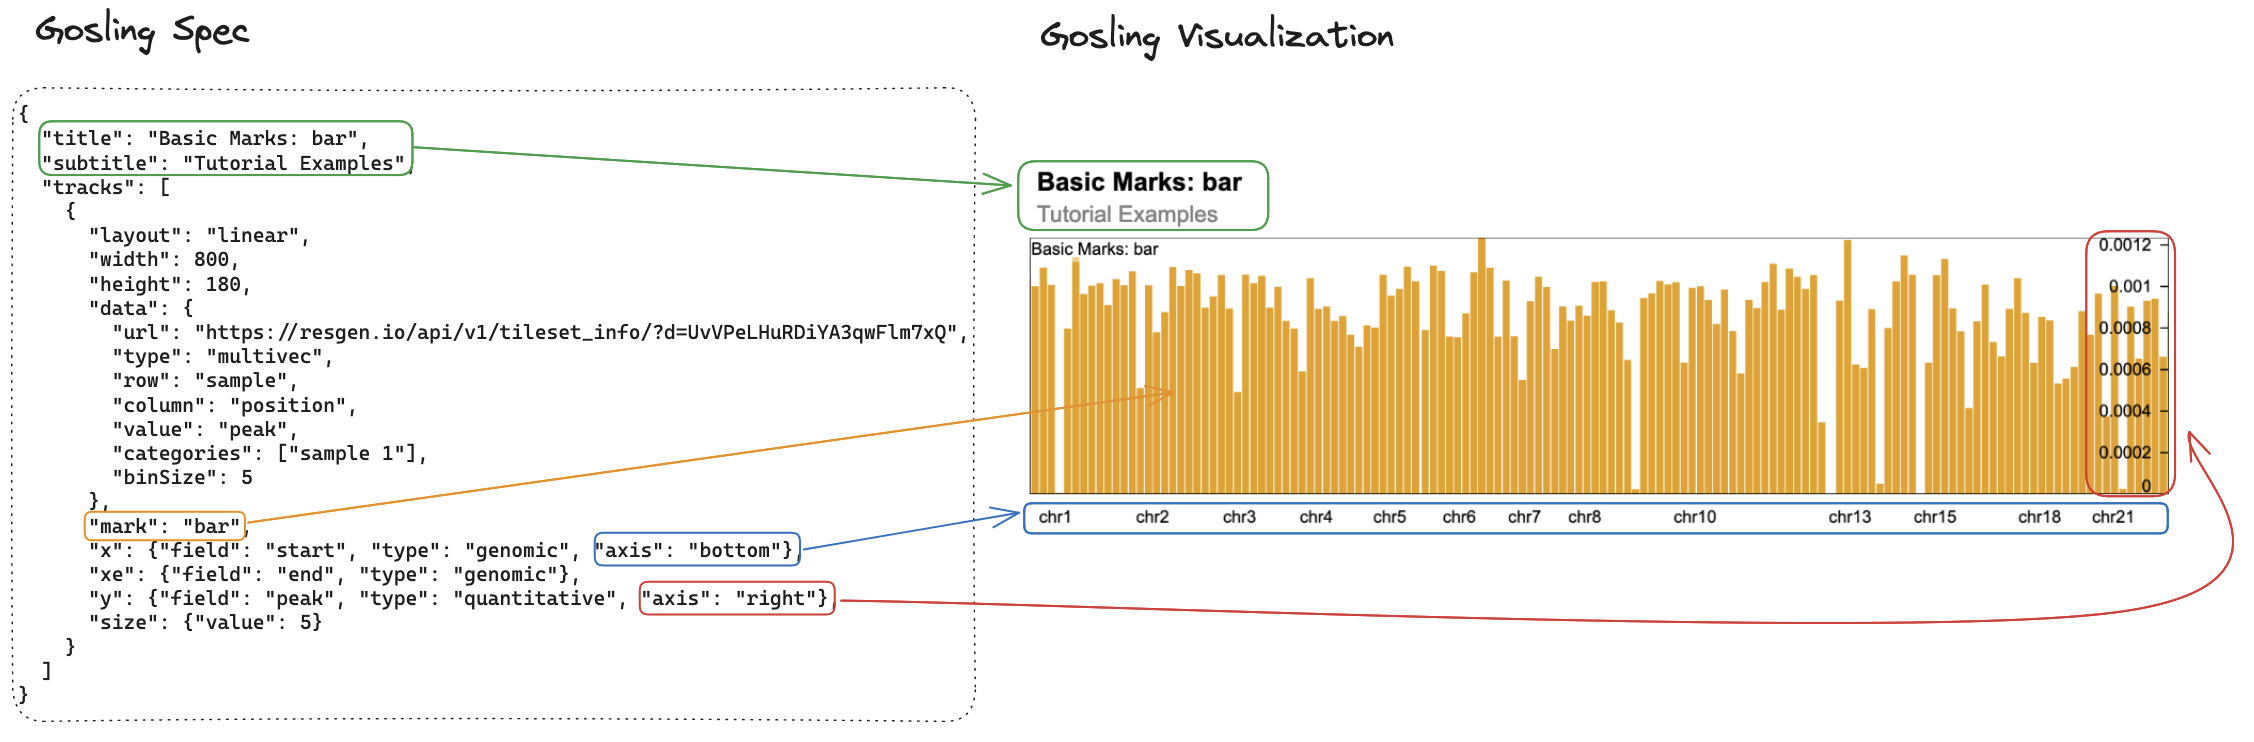
How is the Gosling grammar used in practice? A Gosling visualization is defined using a Gosling specification, which is a JSON object. The structure and values within this JSON object are determined by the Gosling grammar. See the example below to see how parts of a Gosling specification corresponds to its visualization.
JavaScript API
Gosling.js takes the Gosling specification as an input and creates the visualization defined by it. You can programmatically interact with this visualization using JavaScript API functions.
For example, you can use an API function to make the visualization zoom to a particular genomic position, or you can subscribe to click events in the visualization. This is useful to building your own interactive visualizations with Gosling!