User Interaction
Zooming and Panning
Each visualization in Gosling supports the Zooming and Panning interaction. Users can zoom in/out a visualization using the scrolling up/down actions. Users can pan by clicking on the visualization and then drag it in the desired direction.
Zooming and panning are controlled through the static property, which has a default value of false.
When static = true, zooming and panning are disabled.
Users can set the static property of all tracks at the root level or specify it in a single track definition.
{
  "static": true, //disable zoom & pan for all tracks
  "tracks": [
    {
      "static": false, // enable zoom & pan for this track
      ...
    },
    {
      ...
    },
    ...
  ]
}
Linking Views
When views/tracks are linked, the zooming and panning performed in one view/track will be automatically applied to the linked views/tracks.
Views and tracks can be linked through an user-assigned id.
This id is assigned to a track through the x.linkingId property, and assigned to a view through the linkingId property.
// linking serveral tracks
{
  "tracks":[
    // track A
    {
      "data": ...,
      "mark": "rect",
      "x": {
        ..., // other properties of x channel
        "linkingId": "a unique string" // assign a linking id for the track A
      }
    },
    // track B
    {
      "data": ...,
      "mark": "point",
      "x": {
        ..., // other properties of x channel
        "linkingId": "a unique string" // the same linking id links track A and track B
      }
    },
    ... // other tracks
  ]
}
// linking views and tracks
{
  "views": [
    {
      // view A
      "linkingId": "detail",
      ....
    },
    {
      // view B
      "linkingId": "detail",
      ....
    },
    {
      // view C
      "tracks":[
        {
          // this track wil be linked to view A and view B
          "x": {"linkingId": "detail", ...},
          ...
        },
        {...} // without the linkingId, this track will not be linked
      ]
    }
  ]
}
Brushing and Linking
Users can use brushing to select a subset of the data items using a rectangle. Users can modify the left and right edge of the rectangle to modify the selection. The selected data items can be linked to data items in another track.
{
  "tracks":[
    // track A
    {
      "data": ...,
      "mark": "line",
      ...,

      // create a rectangle brush
      "alignment": "overlay",
      "tracks": [
        {}, // this dummy object cannot be removed
        {
          "mark": "rect-brush",
          "x": {"linkingId": "linking-with-brush"}, // assign a unique id to the brush
          "color": {"value":"steelBlue"}
        }
      ]
    },
    // track B
    {
      "data": ...,
      "mark": "point",
      "x": {
        ..., // other properties of x channel
        "linkingId": "a unique string" // the same linking id links track B and the brush in track A
      }
    },
    ... // other tracks
  ]
}
Tooltip
A track can take a "tooltip" property to show a tooltip when the user hovers over the track. The tooltip can display the values of the data fields in the track. The tooltip property takes an array of objects, where each objects has the following properties:
| property | type | description |
|---|---|---|
| string | Required. One of |
| string | Required. Specifiy a data field whose value will show in the tooltip. |
| string | format of the data value. |
| string | Name of the data field for showing in the tooltip. Will use the field name if not specified. |
Here is an example of a tooltip being used in a track definition:
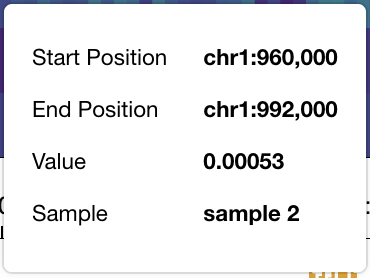
Corresponding specification:
"tracks": [
  {
    ...,
    "tooltip": [
      {"field": "start", "type": "genomic", "alt": "Start Position"},
      {"field": "end", "type": "genomic", "alt": "End Position"},
      {
        "field": "peak",
        "type": "quantitative",
        "alt": "Value",
        "format": ".2"
      },
      {"field": "sample", "type": "nominal", "alt": "Sample"}
    ],
  }
]
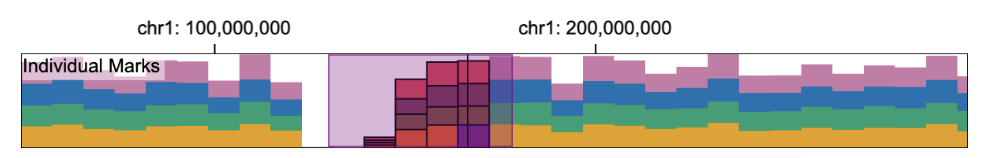
Mouse Interactions
Mouse events can be enabled in Gosling by defining a MouseEvents object in the track definition.
You can use the JavaScript API to subscribe to the mouse-related events, i.e., "mouseOver", "rangeSelect", and "click", to create custom interactions with the visualization. Refer to gosling-react-example to see how mouse events can be used in various use cases. Here is an example of a track with a range selection enabled that enables selecting a genomic range using the click-and-drag interaction after pressing the Alt key:
"tracks": [
  {
    ...,
    "mouseEvents": {"mouseOver": true, "rangeSelect": true},
    // You can also specify the visual properties associated with the mouse events
    "style": {
      "mouseOver": {"color": "blue", "opacity": 0.5, "strokeWidth": 0},
      "select": {"color": "red", "opacity": 0.5},
      "brush": {"color": "purple", "stroke": "purple"}
    }
  }
]
The MouseEvents object can have the following properties:
| property | type | description |
|---|---|---|
| boolean | Whether to send range selection events. |
| boolean | Whether to enable mouseover events. |
| string | Group marks using keys in a data field. This affects how a set of marks are highlighted/selected by interaction. Default: |
| boolean | Determine whether all marks underneath the mouse point should be affected by mouse over. Default: |
| boolean | Whether to enable click events. |