Visual Channel
The visual appearance of a mark is controlled by a set of visual channels (e.g., size, position, and color). One visual channel can be either:
- bound to a data field (as shown in line 13-16)
- assigned a constant value (as shown in line 23).
// an example configuration for a line chart (x and y are encoded)

{
    "tracks":[{
      "data": {
        "url": ...,
        "type": ...
      },
      // specify the mark type
      "mark": "line",

      // visual channel 'x' is bound to a genomic data field
      "x": {
        "field": "position",
        "type": "genomic"
      },
      // visual channel 'y' is bound to a quantitative data field called "peak"
      "y": {
          "field": "peak",
          "type": "quantitative"
          },
      // visual channel color is assigned a constant value
      "color": {"value": "steelblue"}
    }]
}
Encode a Visual Channel
To bind a visual channel to a data field, Gosling creates a mapping from the values of the data field (e.g., [gnes, gpos25, gpos50, ...]) to the values of the visual channel (e.g., the position of a bar).
We call the values of a data field domain and the values of a visual channel range.
For example, the code below creates a mapping from the data field "Stain" to the color of the rect mark.
"gneg" will show as a white rect mark, "gpos100" will show as a black rect mark.
{
  "tracks": [{
    "mark": "rect",
    "color": {
      "field": "Stain",
      "type": "nominal",
      "domain": ["gneg", "gpos25", "gpos50", "gpos75", "gpos100", "gvar"],
      "range": ["white", "#D9D9D9", "#979797", "#636363", "black", "#A0A0F2"]
    },
    ... // other visual channels
  }]
}
As the table shown below, different marks support different visual channels.
| mark type | supported visual channels |
|---|---|
point | x, y, row, size, color, strokeWidth, opacity |
line | x, y, row, color, strokeWidth |
rect | x, xe, row, color, strokeWidth, opacity |
bar | x, y, row, color, strokeWidth, opacity |
area | x, y, row, color, strokeWidth |
link | x, xe, x1, x1e, color, opacity |
triangle | x, xe, row, size, color, opacity |
text | x, xe, row, color, opacity |
Supported Visual Channels
x & xe
x specifies a mark's position in the horizontal direction.
Following the common practice in genomic visluazation, Gosling uses x axis inclusively for genomic coordinates.
| property | type | description |
|---|---|---|
| string | Must be |
| string[] | number[] | Values of the visual channel. |
| string | Users need to assign a unique linkingId for linking views and Brushing and Linking |
| boolean | Whether to display legend. Default: |
| boolean | Whether to display grid. Default: |
| string | Name of the data field. |
| Values of the data | |
| string | One of |
| string | One of |
xe stands for the end position of a visual mark along the x-axis. This is usually used together with x to specify the start and the end positions of a visual mark in the horizontal direction.
y & ye
y specify a mark's position in the vertical direction.
| property | type | description |
|---|---|---|
| boolean | Specify whether to use zero baseline. Default: |
| string | One of |
| string[] | number[] | Values of the visual channel. |
| string | Users need to assign a unique linkingId for linking views and Brushing and Linking |
| boolean | Whether to display legend. Default: |
| boolean | Whether to display grid. Default: |
| boolean | Whether to flip the y-axis. This is done by inverting the |
| string | Name of the data field. |
| string[] | number[] | DomainInterval | DomainChrInterval | DomainChr | Values of the data |
| string|number | Custom baseline of the y-axis. Default: |
| string | One of |
| string | One of |
ye stands for the end of y axis. ye is usually used with y to specify the start position and the end position of a visual mark in the vertical direction, respectively.
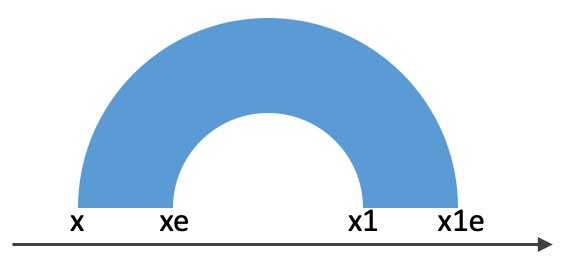
x1 x1e y1 y1e
The four channels are used together only with betweenLink and withinLink marks.
In this case, x and xe are used with x1 and x1e to specify a pair of genomic intervals that need to be connected using band representations. Similarly, y and ye can be used with y1 and y1e to show band connection along the vertical axis.
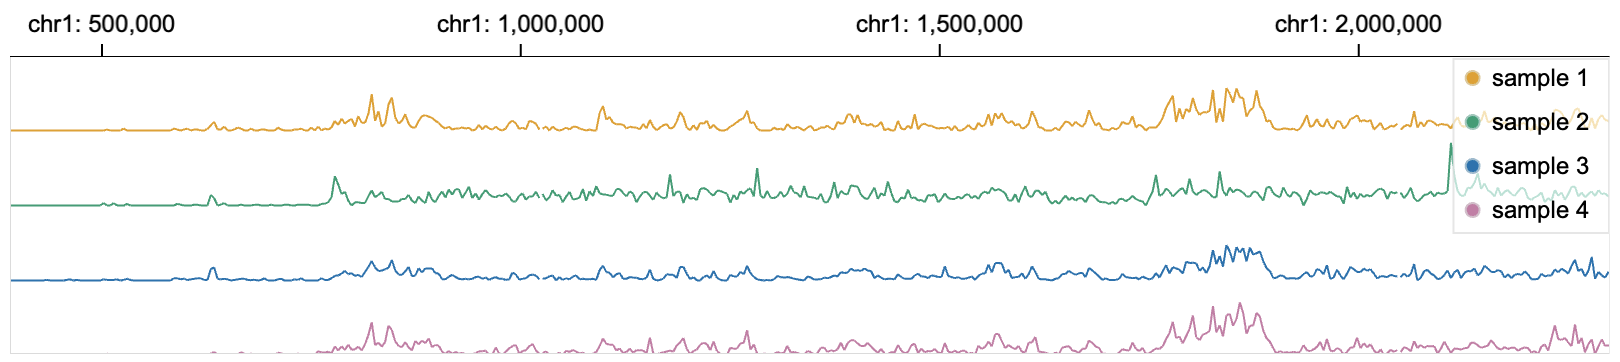
row
Channel row is used with channel y to stratify a visualization with categorical values.
- Without specifying
row:
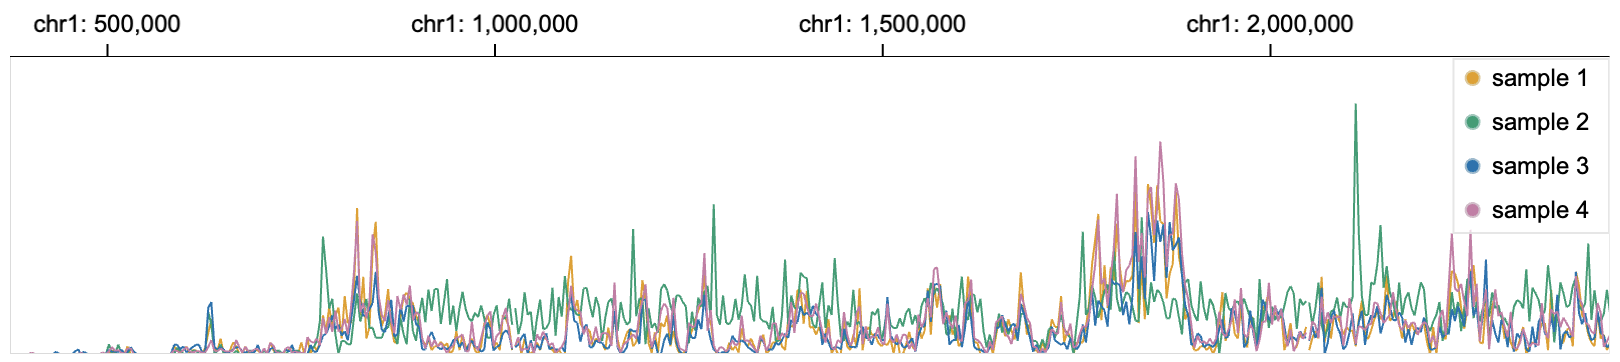
- Line charts are stratified with sample names (
"row": { "field": "sample", "type": "nominal" }).
{
  "tracks":[
    {
      // specify data source
      "data": {
        "url": "https://resgen.io/api/v1/tileset_info/?d=UvVPeLHuRDiYA3qwFlm7xQ",
        "type": "tileset"
      },
      "metadata": {
        "type": "higlass-multivec",
        "row": "sample",
        "column": "position",
        "value": "peak",
        "categories": ["sample 1", "sample 2", "sample 3", "sample 4"]
      },
      // specify the mark type
      "mark": "line",
      // specify visual channels
      "x": {
        "field": "position",
        "type": "genomic",
        "domain": {"chromosome": "1", "interval": [1, 3000500]},
        "axis": "top"
      },
      "y": {"field": "peak", "type": "quantitative"},
      "color": {"field": "sample", "type": "nominal", "legend": true},
      // visual channel row is bound with the data field: sample
      "row": {"field": "sample", "type": "nominal"}
    }
  ]

}
| property | type | description |
|---|---|---|
| string | Must be |
| string[] | number[] | Determine the start and end position of rendering area of this track along vertical axis. Default: |
| number | Determines the size of inner white spaces on the top and bottom of individiual rows. Default: |
| boolean | Whether to display legend. Default: |
| boolean | Whether to display grid. Default: |
| string | Name of the data field |
| string[] | number[] | Values of the data |
| boolean | Clip row when the actual y value exceeds the max value of the y scale. Used only for bar marks at the moment. Default: |
size
Channel size indicates the size of the visual mark. It determines either the radius of a circle (mark: point), the vertical length of a triangle (mark: triangleRight, mark: triangleLeft, mark: triangleBottom), the vertical length of a rectangle (mark: rect), the thickness of a line (mark: line).
| property | type | description |
|---|---|---|
| string | One of |
| string[] | number[] | Ranges of visual channel values |
| string | Name of the data field |
| string[] | number[] | Values of the data |
text
text channel is used only in text mark to specify what textual information to display.
| property | type | description |
|---|---|---|
| string | One of |
| string[] | Ranges of visual channel values |
| string | Name of the data field |
| string[] | Values of the data |
color
The channel color specifies the foreground color of a mark.
| property | type | description |
|---|---|---|
| string | One of |
| string | Title of the legend. Default: |
| number[] | Whether to use offset of the domain proportionally. This is bound to brushes on the color legend. Default: |
| string | One of |
| string[] | number[] | string | Determine the colors that should be bound to data value. Default properties are determined considering the field type. |
| boolean | Whether to display legend. Default: |
| string | Name of the data field |
| string[] | number[] | Values of the data |
stroke
Channel stroke defines the outline color of the specified mark. Gosling supports stroke in the following marks: rect, area, point, bar, link.
| property | type | description |
|---|---|---|
| string | One of |
| string | Title of the legend. Default: |
| number[] | Whether to use offset of the domain proportionally. This is bound to brushes on the color legend. Default: |
| string[] | number[] | string | Ranges of visual channel values |
| boolean | Whether to display legend. Default: |
| string | Name of the data field |
| string[] | number[] | Values of the data |
strokeWidth
Channel strokeWidth defines the outline thickness of the mark shape. Gosling supports strokeWidth in the following marks: rect, area, point, bar, link.
| property | type | description |
|---|---|---|
| string | One of |
| string[] | number[] | Ranges of visual channel values |
| string | Name of the data field |
| string[] | number[] | Values of the data |
opacity
The opacity channel determines the transparency level of a mark. The opacity of the foreground color (i.e., color) and the outline color (i.e., stroke) will be affected by this channel.
| property | type | description |
|---|---|---|
| string | One of |
| string[] | number[] | Ranges of visual channel values |
| string | Name of the data field |
| string[] | number[] | Values of the data |
Style-related Properties
{
  "style": {
    /**
     * style-related properties
     * specify the style of all tracks
     */
  }
  "tracks": [
    {
      ...,
      "style": {
        /** specify the style of a single track */
      }
    },
    ...
  ],
  ...
}
These properties specify the visual appearances of a track that are not bound with data fields.
| property | type | description |
|---|---|---|
| boolean | Whether to show vertical lines that connect to the baseline (axis) when |
| number | Specify the stroke width of |
| string | Specify the stroke of |
| string | One of |
| number | Specify the font size of |
| string | One of |
| Customize visual effects of | |
| number | |
| string | |
| Customize visual effects of | |
| string | One of |
| string | One of |
| number | The minimum height of |
| string | One of |
| Each object follows the format | |
| string | If defined, show legend title on the top or left |
| boolean | Specify whether to show legend in a single horizontal line? |
| boolean | Whether to enable smooth paths when drawing curves.
Default: |
| number | Offset the position of marks in y direction. This property is currently only supported for |
| number | Offset the position of marks in x direction. This property is currently only supported for |
| number[] | Specify the pattern of dashes and gaps for |
| string | One of |
| Customize the style of the brush mark in the | |
| number | |
| string | |
| string | One of |